What stood out most was the quality of our sales calls. Prospects arrived at demos having already read the comparison pages, run the ROI numbers, knew exactly where we fit. Sales calls shifted into implementation discussions instead of discovery, cutting about three weeks off our cycle.
The Challenge: High Traffic, Low Trial-to-Revenue Conversion
When Allyson, the founder reached out, the situation didn’t immediately present itself as an SEO or acquisition problem.
Organic traffic was growing at a reasonable pace, content production had been consistent for over a year, and trials were being generated every month. From an internal reporting standpoint, marketing activity looked healthy enough that nothing obviously appeared broken.
But revenue wasn’t keeping pace. And no one could clearly point to where momentum was being lost.
So instead of proposing channel work upfront, we spent two weeks running a diagnostic across the full inbound funnel, mapping how acquisition, positioning, and activation were interacting.
As Allyson put it after receiving the audit:
“I’ve been in growth roles for eight years, so I know when an agency’s just running through a template. This wasn’t that. Muiz looked at our full motion: organic performance, messaging clarity, trial experience, and showed how they were all undermining each other. That clarity alone gave us the most actionable growth roadmap we’ve had in years.”
— Allyson, Founder
When we pulled everything together, three things stood out:
- 5 articles on PM best practices
- 4 covering OKRs
- 4 focused on roadmap planning

| Topic | Example Content |
|---|---|
| Change management | “How do we migrate 200 users from Asana without productivity loss?” |
| Financial justification | “What’s the measurable 12–24 month ROI against our current tooling stack” |
| Vendor comparison | “Where does this outperform Monday.com for mid-market engineering teams?” |
The Solution: Content Consolidation, Sales-Led Bottom-Funnel Guides, and Comparison Assets
The audit gave us a clear enough picture that we didn’t need to debate priorities.
Three things needed to happen, roughly in order: clean up what was undermining the existing content, fix what visitors were landing on, then build the content the buying committee needed to move deals forward.
We had one quarter.

Content Consolidation
We also added FAQ, Author, and Review schema site-wide, because LLMs increasingly pull from structured, credible sources.
Result: Rankings stabilised within three weeks. Within four, sales had started using the OKR pillar in late-stage deals to handle objections, which told us the content was reaching the right people.
Sales-Led BOFU Buildout
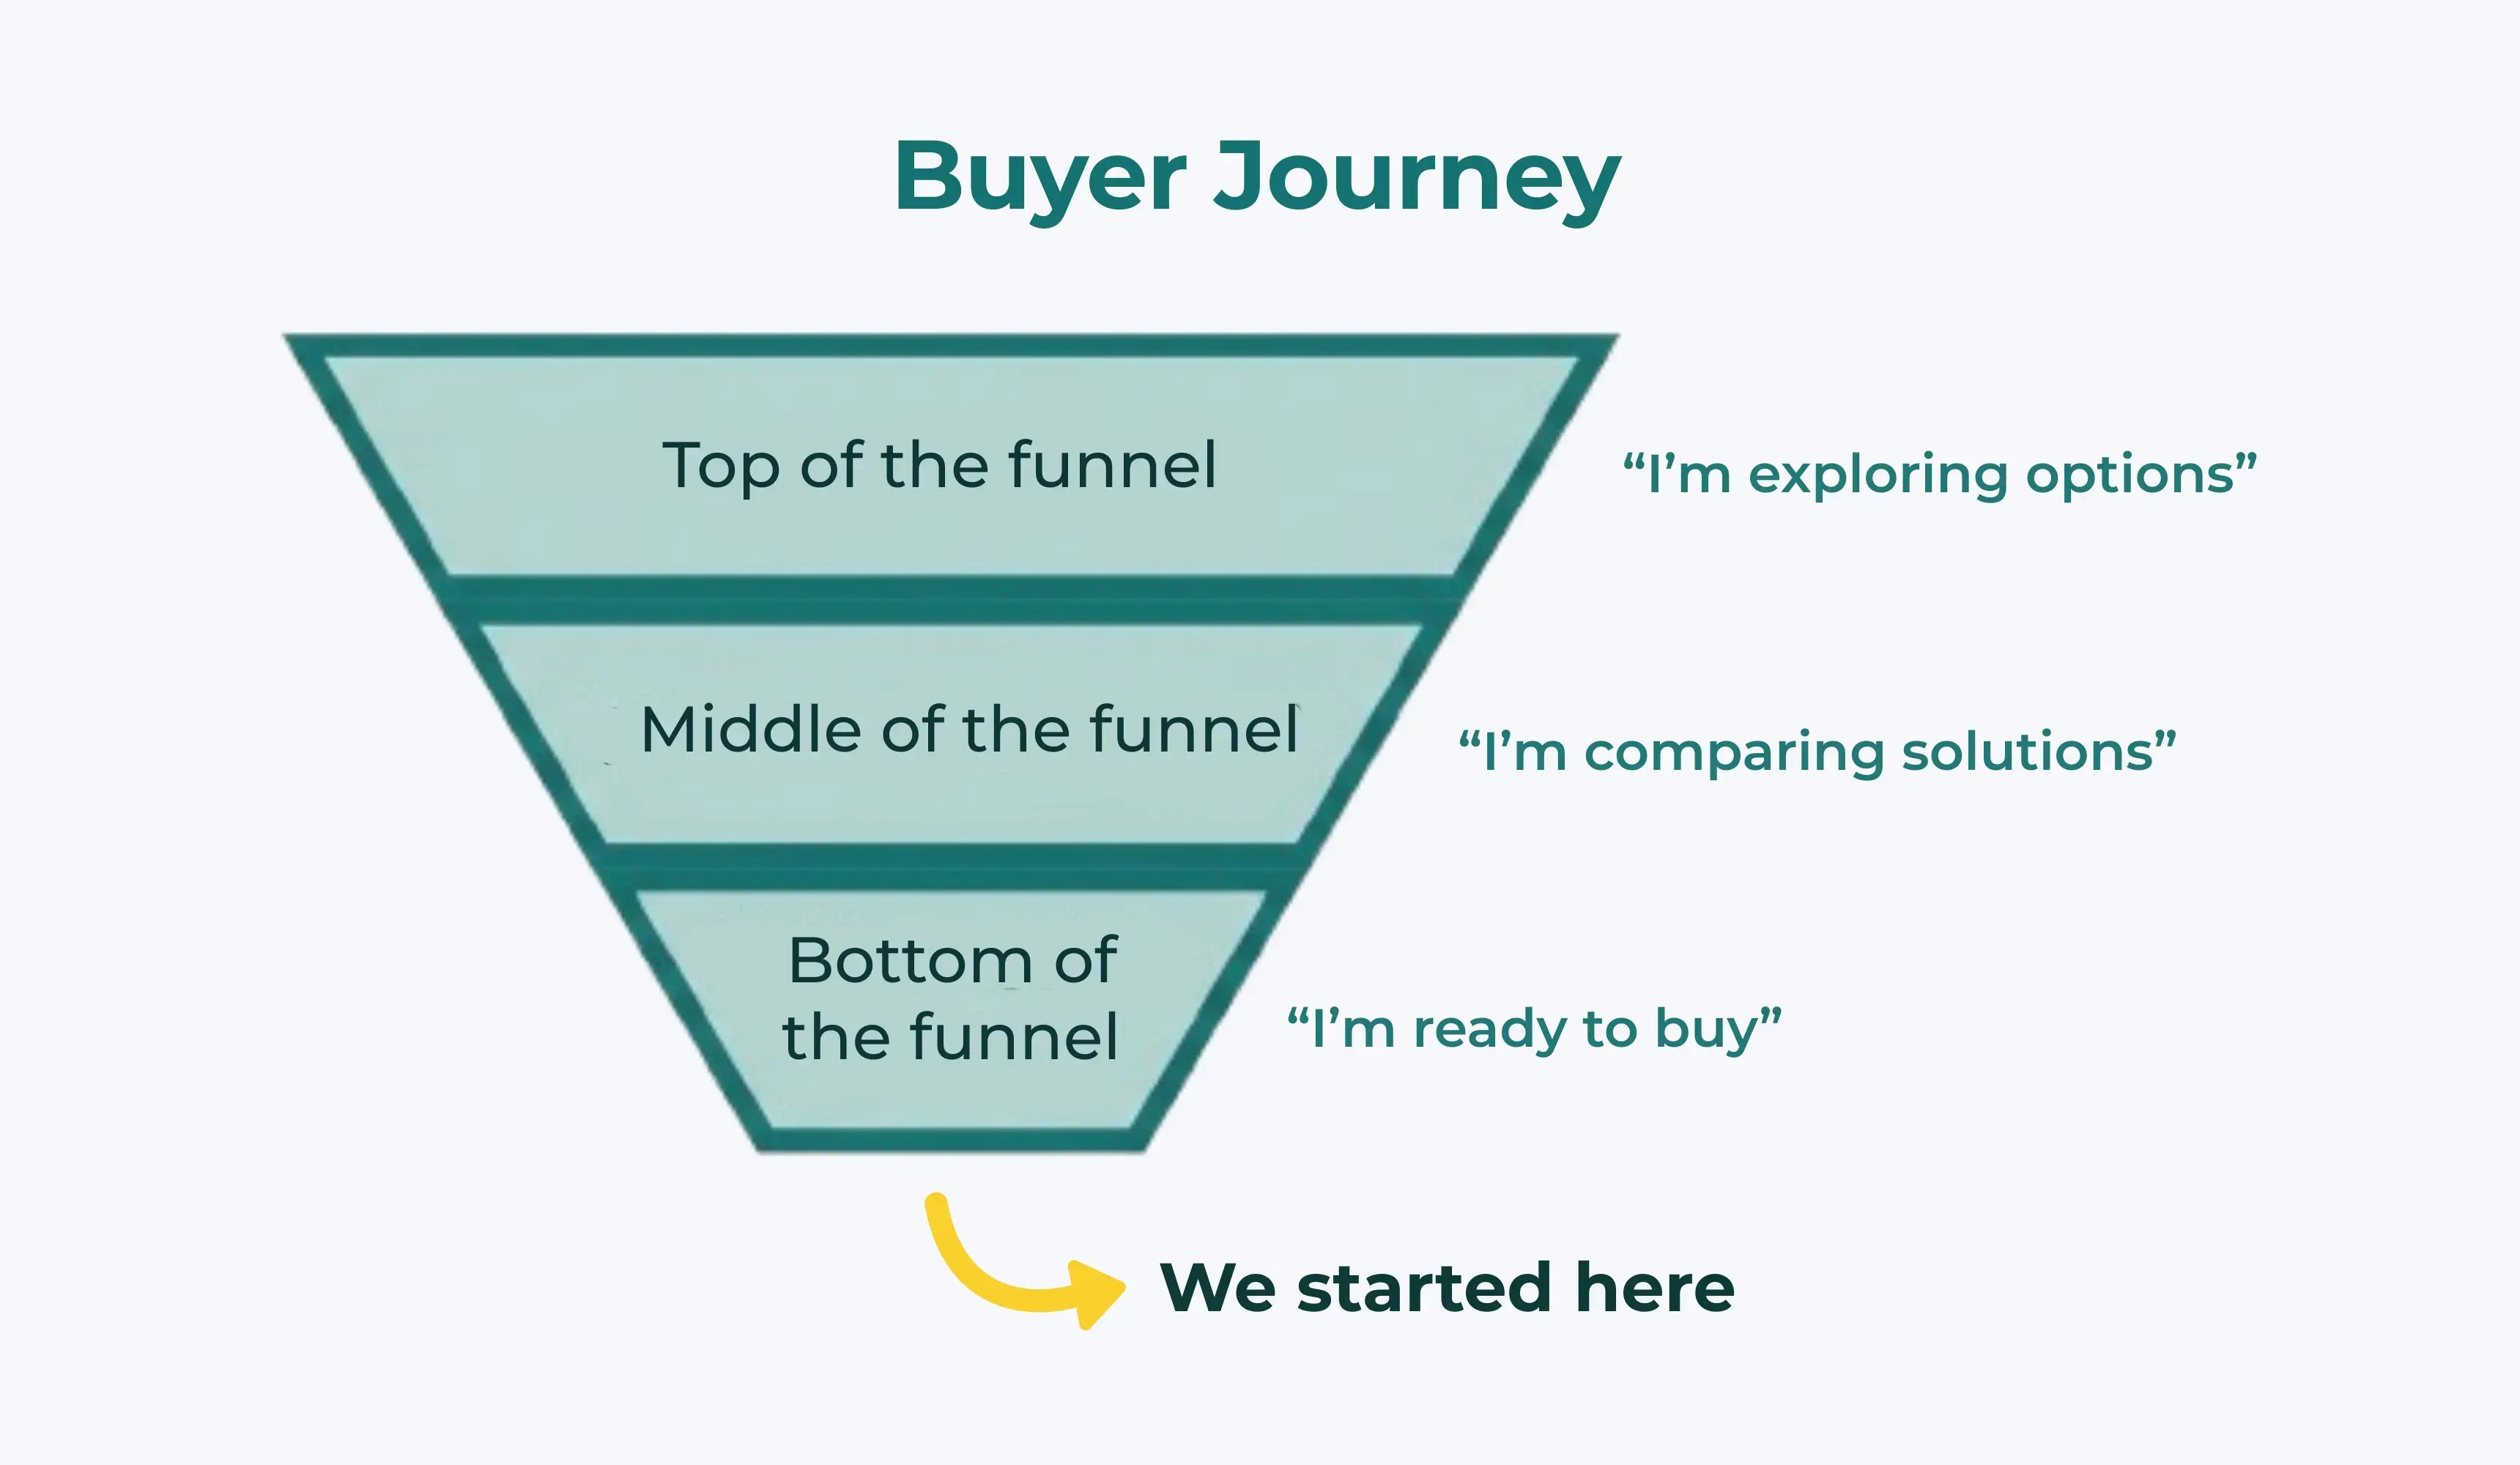
When a product is bought by a committee: a VP championing it, finance stress-testing the ROI, procurement checking the contract, the fastest path to revenue is getting in front of buyers who are already aware of their problem and actively comparing solutions.
Top-of-funnel content wouldn’t have moved those deals.
Before briefing a single article, we spent time with Allyson’s sales team going through CRM notes and demo recordings.
We also brought in a contract writer and had them shadow the product team for a week: demo calls, support tickets, internal walkthroughs.
Each piece was also mapped to a specific sales stage. We documented which asset to send at which point in the deal, so the content actually became part of how the sales team handled objections and kept deals moving.
Comparison Content Strategy
So we started with one page to prove the concept, a direct comparison built as a genuine buying guide. That meant being upfront about fit, including where a competitor made more sense for a specific use case.
The first page became the most visited on the site. After that, the conversation about whether to create more of them was short.
Full-Funnel SEO Attribution Setup with BigQuery and Looker Studio
GA4 alone couldn’t tell us which content was actually influencing conversions.
It only tracks the last page someone visited before submitting a request, which in almost every case was the demo page itself. That tells you nothing about the journey that got them there.
So we set up full-funnel tracking via BigQuery and Looker Studio. With our new set-up we could report on:
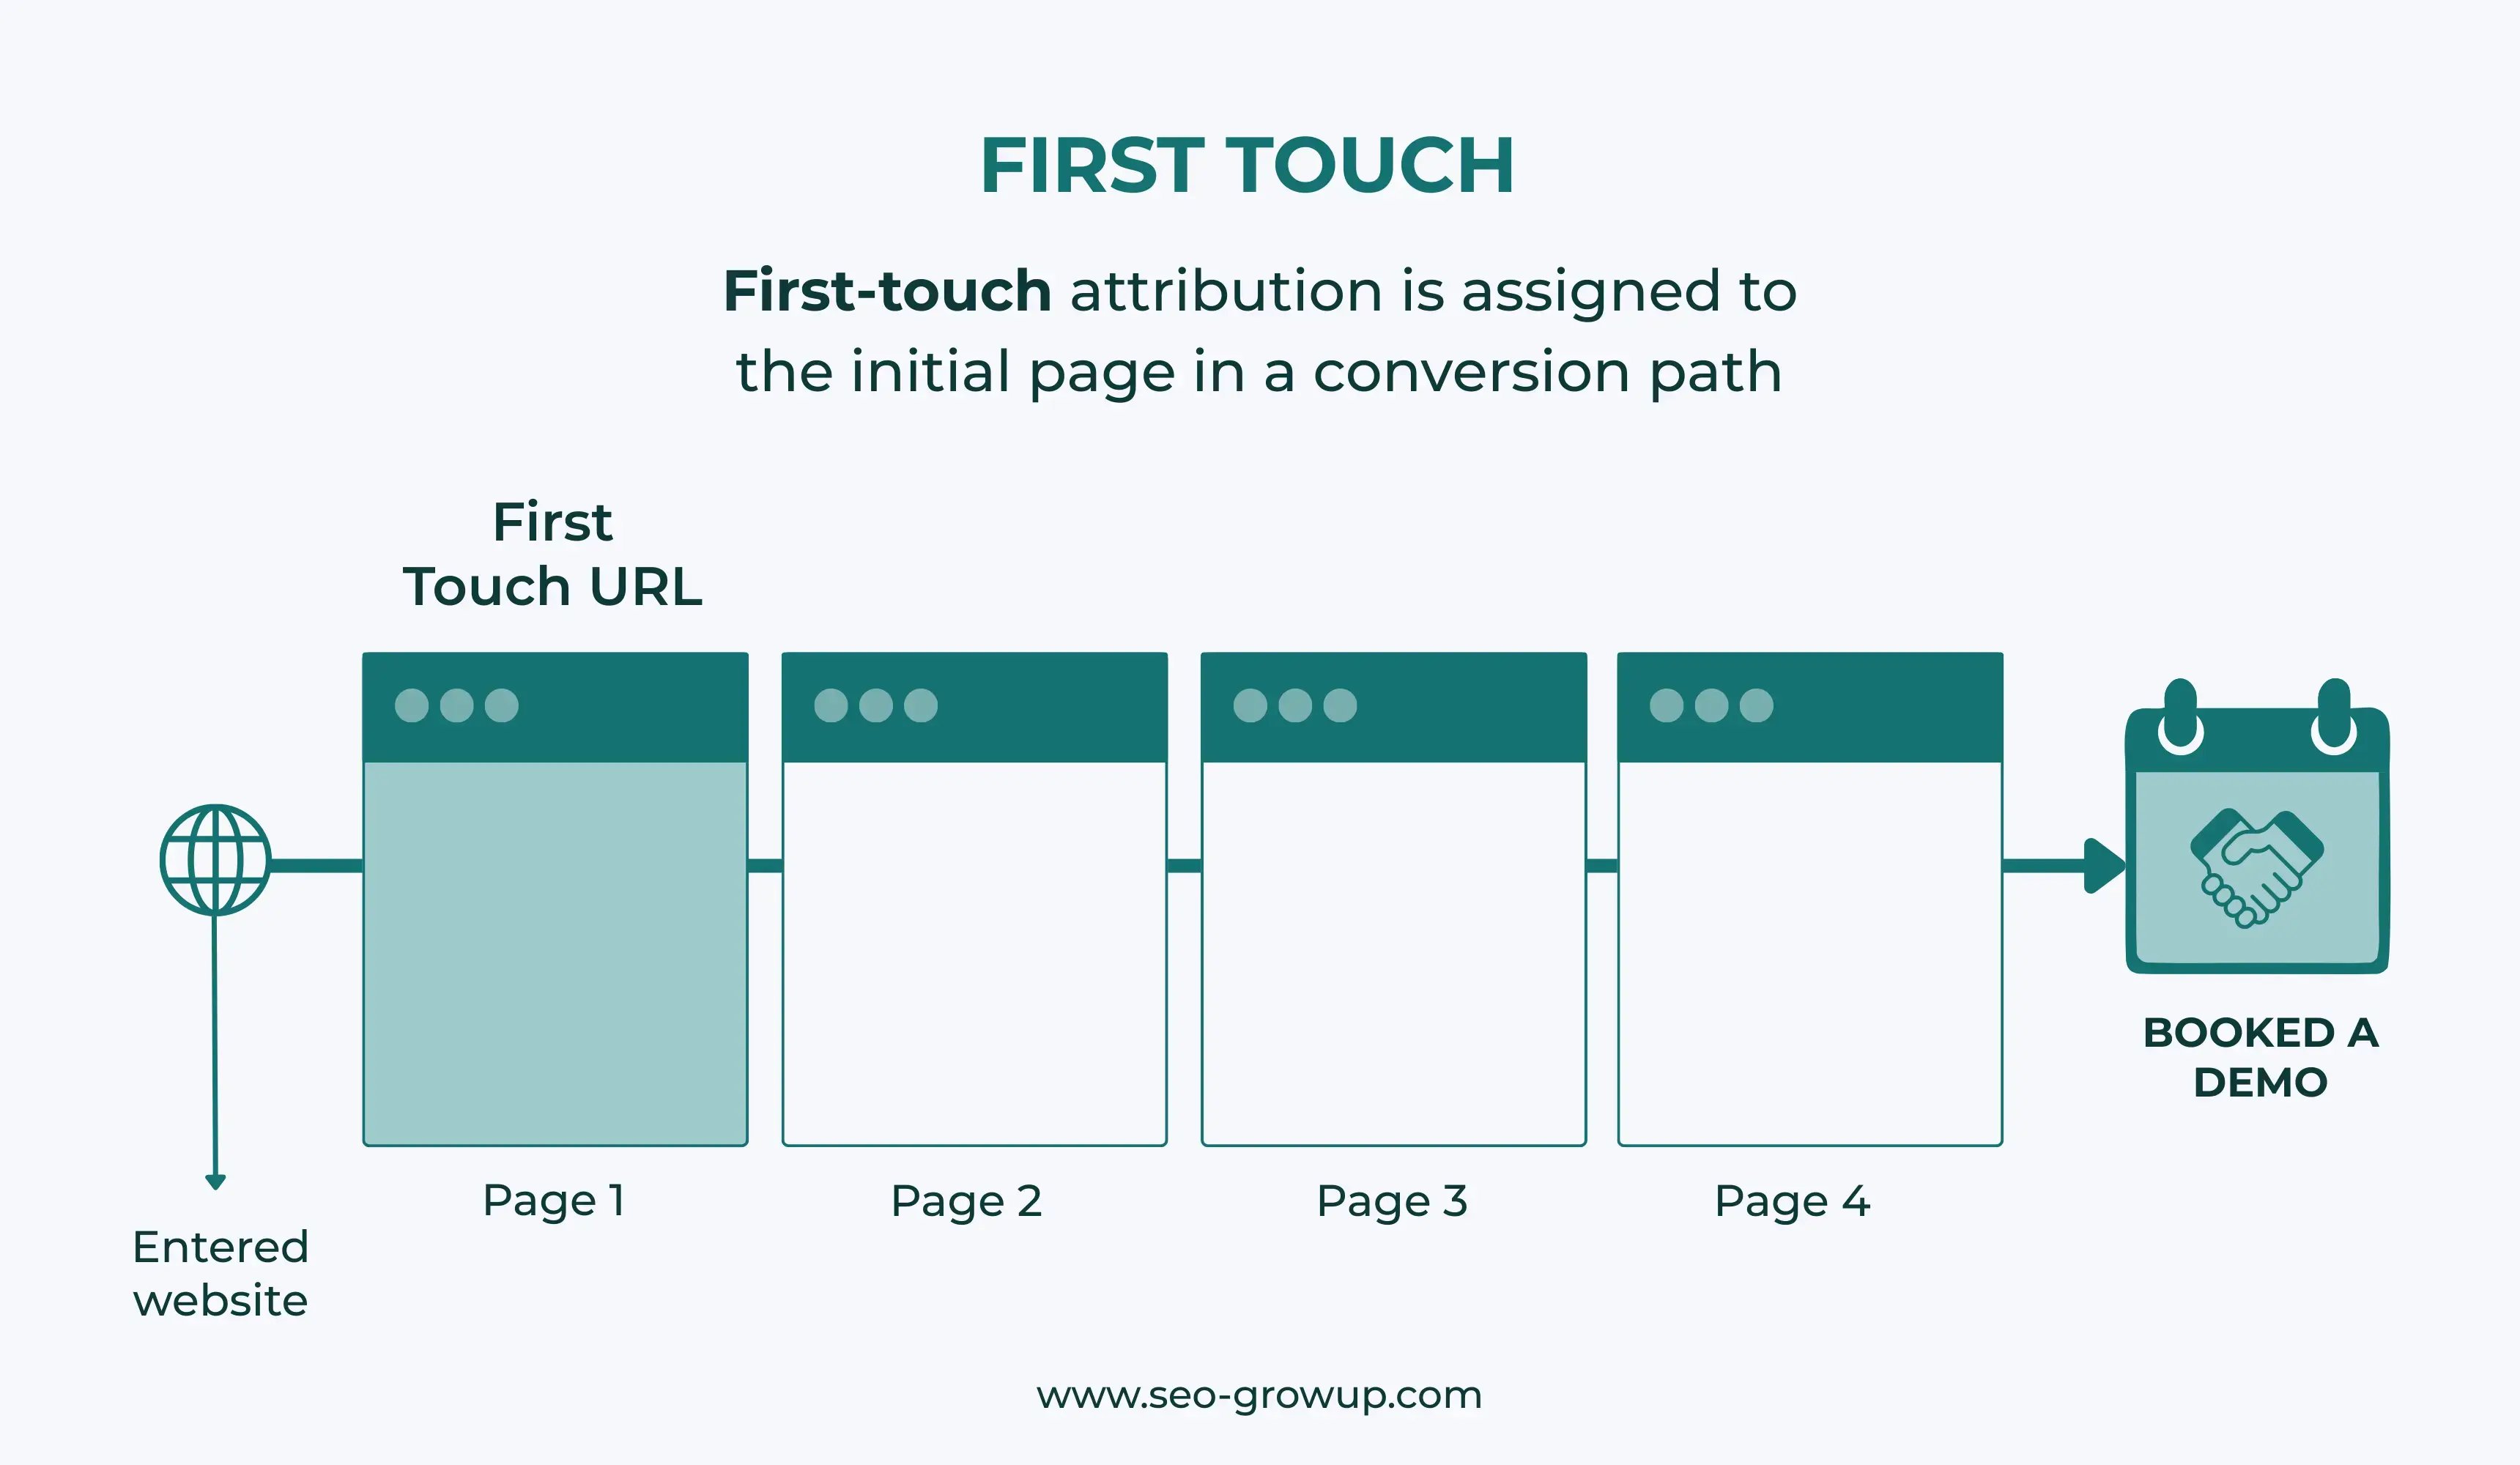
- First touch: what was the very first page they visited?
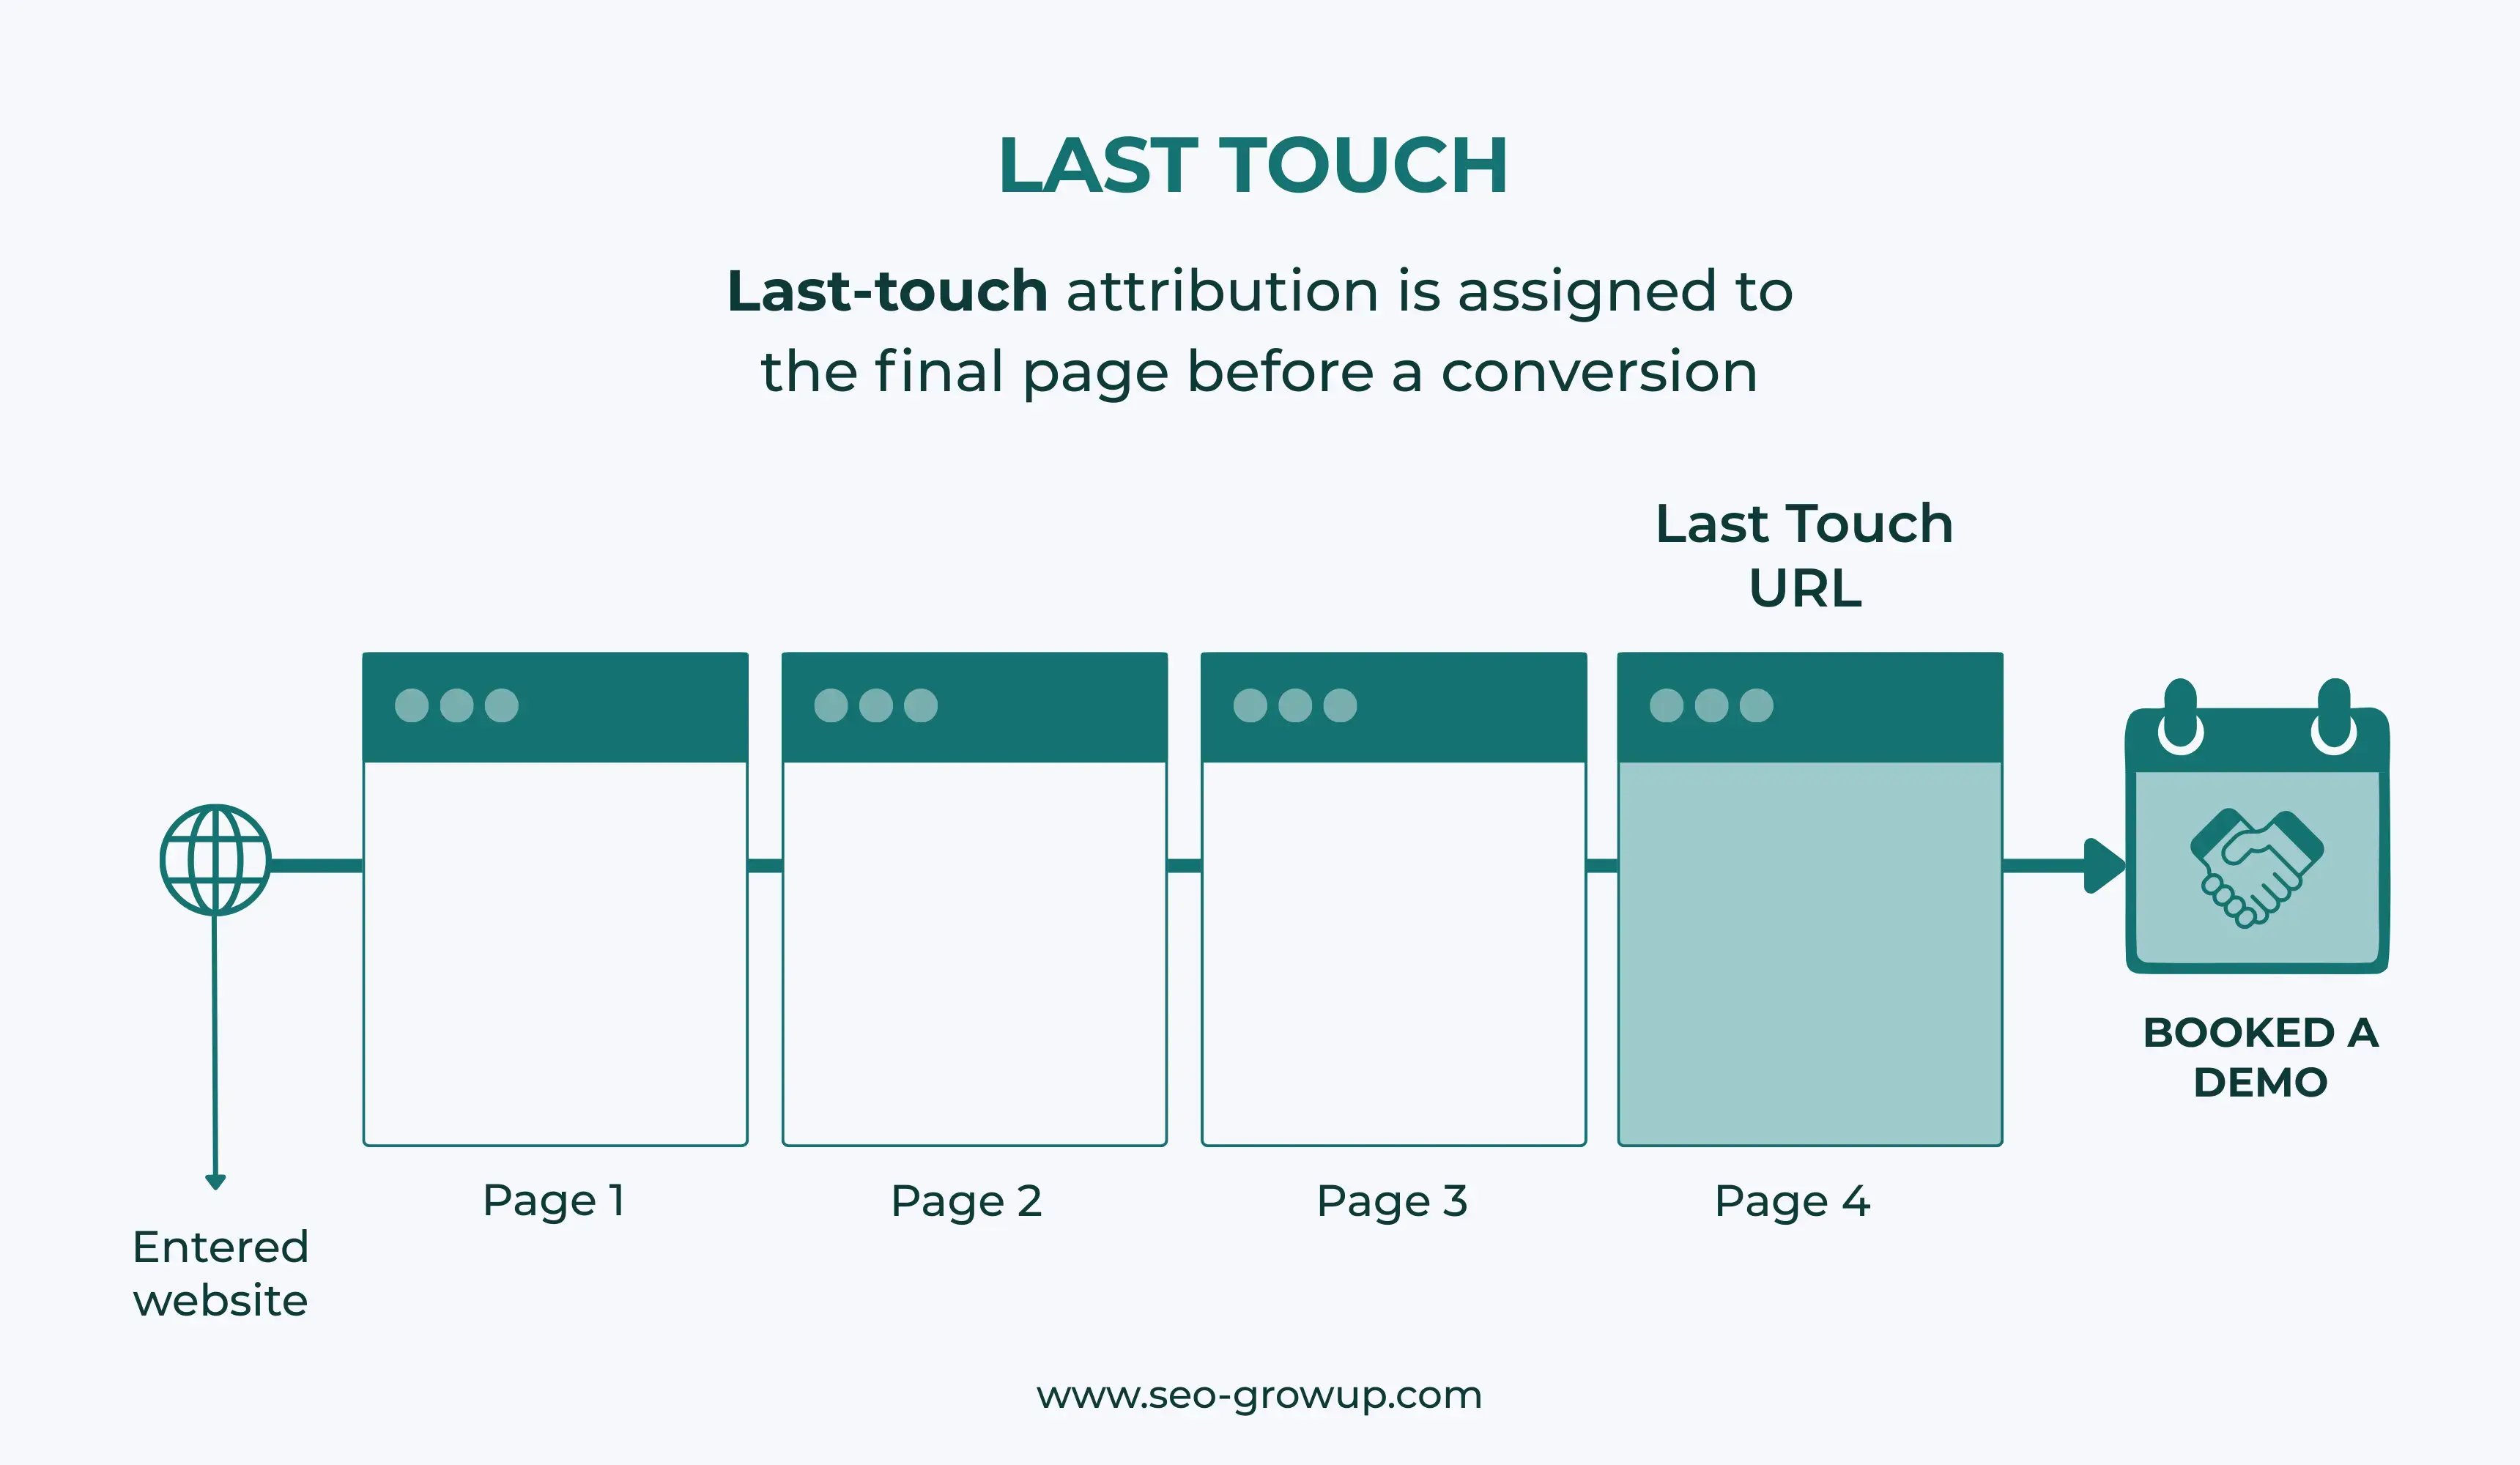
- Last touch: what did they read immediately before booking the demo?
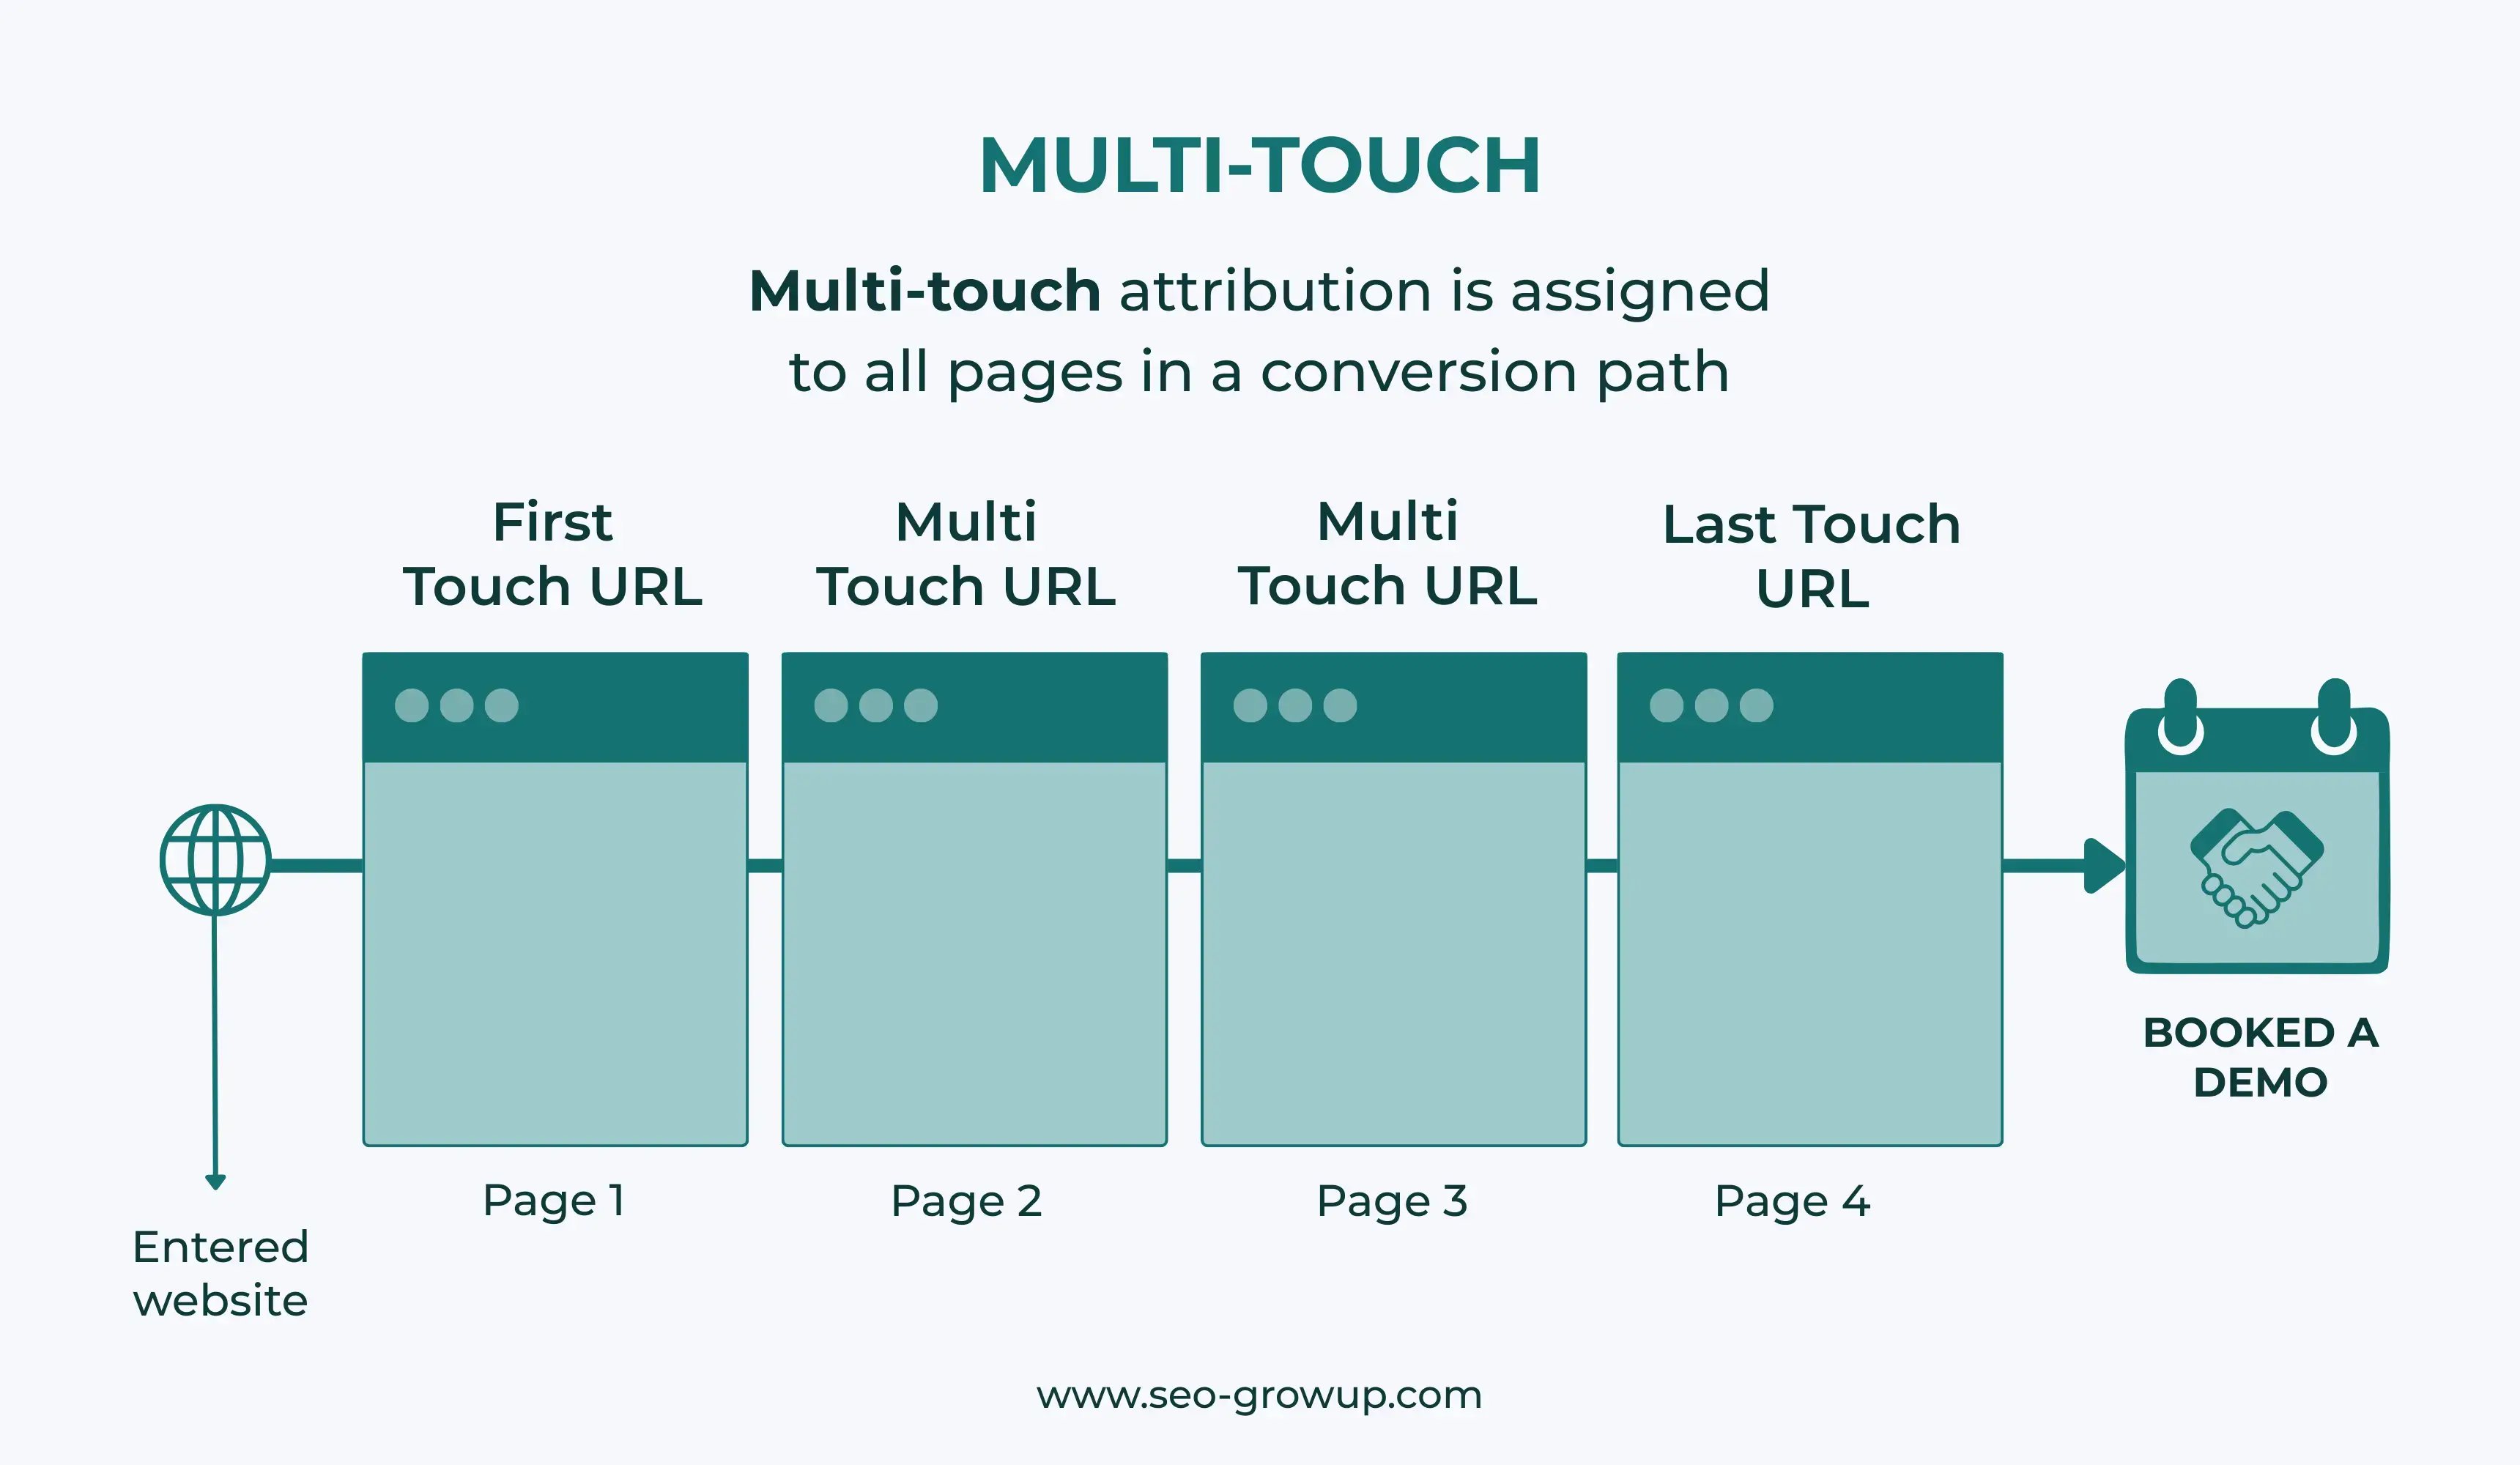
- Multi-touch: every page they visited across their entire journey, from first session to conversion.
Here’s a visual way to think about each of those three views:
This is what the data actually looked like when we pulled all three views together, across every converting user journey over six months:
![]()
Take the OKR implementation guide.
In first touch, it was the single biggest entry point into the funnel: 187 prospects found the product for the first time through that one page. But in multi-touch, it showed up in 38 converting user journeys with 847 page views, meaning buyers kept coming back to it throughout their evaluation.
And the CFO ROI guide, which had no first-touch volume at all, showed up in 9 converting journeys in multi-touch, meaning it was quietly influencing deals mid-evaluation without ever being the entry point. Last-touch attribution alone would have made it look like an underperformer.
Pulling the attribution data through to HubSpot meant we could also track lead quality all the way to close, not just which content was driving demos, but whether those demos were actually turning into closed-won deals.
At their average ACV of $25k, the 189 demo conversions influenced through content represented roughly $4.7M in pipeline.
The Results
We'd set specific targets at the outset: double demo bookings, increase trial conversion by at least 40%, bring CAC down by at least a third. We hit every benchmark, and in some cases, exceeded them.
pipeline generated
acquisition cost
The downstream effects were just as meaningful. Average sales cycle dropped from 87 days to 64 days because prospects were arriving further along in their evaluation. Demo-to-close also improved from 23% to 37%, with the content doing the qualification work upfront.
Calculate the Revenue Your Content Should Already Be Generating
Allyson’s team was generating 2 customers per 1,000 visitors and couldn’t pinpoint where the other 998 were going.
Six months after rebuilding the content around pipeline, demo bookings had nearly tripled and CAC dropped by 38%.
Enter your numbers to see what that shift looks like at your scale.
Forecast Your Revenue Potential