The hardest part about building in B2B right now is that you’re mostly selling to ghosts. 81% of buyers have already shortlisted you, or disqualified you, before you even know they exist. By the time someone fills out a form or books a demo, the decision is already half-made.
That invisible buying journey is what makes GTM so unforgiving in 2026. When I’m working through GTM advisory sessions with clients, the first thing we do is stop the “spray and pray” madness.
To scale in this environment, you have to get precise about who you’re selling to, how you’re reaching them, and what motion actually fits your deal size.
Building an Evidence-Led Ideal Customer Profile (ICP)
Most GTM failures trace back to the first ninety days. Not because teams picked the wrong channels or hired the wrong people, though they often did those things too, but because they never properly defined who they were selling to.
I mean really defined it.
| ICP Type | Example |
|---|---|
| Generic ICP (Too broad to be actionable) |
“B2B SaaS companies with 50–500 employees in North America.” |
| Functional ICP (Specific, data-driven, and actionable) |
“B2B SaaS companies with 100–300 employees, $10M–$30M ARR, selling to enterprise, using Salesforce, growing 30%+ YoY, and struggling with forecast accuracy.” |
Getting that specific doesn’t happen by accident. Here’s exactly how to build it from the ground up.
Step 1: Gather the Data You Already Have
Start with your existing customer base, even if it’s small. Pull every customer from your CRM and map them against firmographic and behavioral criteria:
| Data Type | Key Dimensions and Indicators |
|---|---|
| Firmographics Who they are |
|
| Behavioral Signals How they act |
|
Look for what your best customers share that your churned ones don’t. If both groups use Google Analytics, that tells you nothing. If churned accounts skew retail and closed-won skew B2B SaaS, that’s a signal worth chasing.
For each account, add a simple layer of commercial context so you can rank them. Note their:
- Company name and ARR
- Churn rate and NPS
- Product usage level (high/medium/low)
- Time to first value
Sort by highest LTV and lowest churn. Those are your power users. Look for patterns and take notes.
Step 2: Use AI to Detect Micro-Niches
Feed your customer data into an AI enrichment tool, platforms like Keyplay, Clearbit, or even ChatGPT with the right prompts, and ask it to identify patterns you’re missing. Specifically:
- What technographic signals correlate with high-value accounts? (e.g., “uses Salesforce + HubSpot + Gong”)
- What hiring trends indicate readiness to buy? (e.g., “recently hired VP of Sales” or “scaling SDR team”)
- What funding events create urgency? (e.g., “closed Series B in last 6 months”)
Output this into distinct micro-niches. For example:
| Segment | Profile & Characteristics |
|---|---|
| Segment A |
|
| Segment B |
|
Step 3: Size Your TAM and Prioritise a Beachhead
Once you have 3-5 micro-niches defined, resist the urge to go after all of them at once. Pick one beachhead market where you can dominate.
For each segment, calculate addressable accounts:
- How many companies match your firmographic + technographic criteria?
- What’s the realistic penetration rate you can achieve in 12-18 months?
- What’s the estimated revenue potential per account (ACV × likely expansion)?
Choose the segment with the highest density of ICP-fit accounts and the clearest path to initial traction. This becomes your primary focus. The others remain secondary targets you can layer in once you’ve nailed the first motion.
Step 4: Validate With Customer Interviews
Interview 10-15 of your best customers. Ask:
- What problem were you trying to solve when you found us?
- What alternatives did you consider?
- What internal trigger caused you to start looking? (e.g., missed quarterly target, new executive, compliance deadline)
- What almost stopped you from buying?
Ground your ICP in reality through CRM data, analytics, and customer interviews. Use this qualitative insight to sharpen your positioning and identify buying triggers you can target in your GTM motion.
Step 5: Document Your ICP
Condense everything into a one-page ICP document. It should include:
| ICP Component | What to Include |
|---|---|
| Executive Summary 2-3 sentences defining ideal customer |
|
| Firmographics Company profile basics |
|
| Technographics Key tools in their stack |
|
| Pain Points Top 3 problems they’re solving |
|
| Buying Triggers Events creating urgency |
|
| Current Workarounds What they're using now |
|
| Decision-Makers Who signs off |
|
This document becomes your North Star. Share it with product, marketing, and sales. Update it quarterly as you learn more.
If you want a head start, we’ve built a tool to help you do exactly this, fill it out below and walk away with a ready-to-use ICP.
Defining Your GTM Motion and Pricing Model
You’ve nailed your ICP. Now comes the question that determines everything else: how will you actually go to market?
The honest answer for most B2B SaaS companies in 2026 isn’t “product-led” or “sales-led.” It’s “it depends on the deal size and who’s buying.”
Let me simplify this.
| Growth Motion | When It Works | Examples |
|---|---|---|
| Product-Led Growth (PLG) | ACV under $10-25K, implementation under 30 days, self-service onboarding, single decision-maker | Notion, Calendly, Slack |
| Sales-Led Growth (SLG) | ACV $50K-$500K, 90+ day sales cycles, requires customisation and integration, multiple stakeholders | Salesforce, Workday, Snowflake |
| Hybrid Motion | Multiple market segments (SMB to enterprise), PLG for adoption with sales-assist for expansion | Atlassian, Dropbox, HubSpot |
In almost every GTM consulting engagement I run with B2B SaaS teams, the answer lands in hybrid. A freemium tier or free trial generates product-qualified leads (PQLs), high-intent users get routed to sales, and the motion builds from there. HubSpot does this beautifully. So does Figma.
Pricing Models and the Rise of Hybrid
Pricing is inseparable from motion. We often see pricing set in isolation from buyer behaviour. In 2026, this approach is fatal.
Buyers expect pricing that scales with usage and value; investors expect pricing to support high Net Revenue Retention (NRR) and efficient Customer Acquisition Cost (CAC) payback.
Against that backdrop, four pricing models are pulling ahead as the dominant plays in 2026, each suited to different motions and buyer behaviour.
| Pricing Model | Fit & Structure | Why It Works (or Doesn’t) |
|---|---|---|
| Flat-Rate Pricing | One price, unlimited everything. Perfect for SMB PLG where conversion velocity and word-of-mouth outweigh usage optimisation. | No sales friction, no expansion conversations, no procurement headaches. The trade-off: your NRR caps at 100% and heavy users subsidise light users. Only works if your cost structure is flat, not usage-dependent. |
| Tiered Pricing | Good/better/best packages capture different willingness to pay. Most common in SaaS because it’s familiar to buyers and easy to explain. Expansion happens through tier upgrades, typically driven by feature gates or seat limits. | Buyers understand it instantly. Your job is tier design: too few tiers and you’re undermonetising, too many and you create analysis paralysis. The middle tier should capture 50-60% of customers if you’ve nailed it. |
| Usage-Based Pricing | Pay for what you consume. Typically drives NRR uplift, lowers entry barrier, and aligns cost with value. Revenue becomes less predictable, usage drops in downturns, and spikes are hard to forecast. Your finance team will hate you until your ARR hits $50M. | Works when consumption ties directly to customer success (more API calls = more revenue for them). Fails when usage is lumpy or disconnected from value. Requires infrastructure costs that scale with usage to maintain margins. |
| Hybrid Pricing | Seat-based base + usage overage. Predictable baseline revenue plus expansion upside. The smart default for B2B SaaS in 2026, you get both worlds if you don’t overcomplicate it. | Balances predictability (finance loves it) with expansion potential (investors love it). The danger is complexity, if buyers need a calculator and three meetings to estimate their bill, you’ve lost. Include enough usage buffer in the base price that 70% of customers never hit overages. |
Putting It Together: Motion + Pricing + ICP
The interplay between motion, pricing and ICP is where GTM strategy becomes art. For each micro‑niche, ask:
| Strategic Question | How to Think About It |
|---|---|
| ACV & Complexity What deal size? |
Pull contract size data from your CRM before making assumptions. Under $15K sits in SMB territory, $30–75K is mid-market, $150K+ requires a fundamentally different sales motion. Onboarding complexity should inform that boundary as much as deal size. |
| Motion Fit PLG, hybrid, or sales-led? |
Let sales call data and product analytics define where qualified buyers are disengaging. A $20K deal with fast time-to-value will almost always suit a PLG motion with sales-assist; forcing a full enterprise sales cycle onto it will kill conversion. |
| Pricing Alignment Value ↔ usage match? |
API-heavy products with measurable consumption metrics suit a base plus overage structure. High-complexity, multi-stakeholder deals suit tiered per-seat. Where neither fits cleanly, hybrid is the more defensible starting point. |
| Expansion Triggers What drives upsell? |
Define success milestones before setting tier limits: seats added, features unlocked, usage thresholds reached. Those triggers need to be architected into your pricing from the start, not bolted on when NRR targets aren’t being met. |
Channel Prioritisation: Where to Put Your Budget and When
You know your ICP. You’ve chosen your motion. Now: where does the budget go?
Most teams answer that question by spreading spend across eight channels at once. LinkedIn, Search, outbound, ABM, events, all running in parallel, all starved of resource, none of them working well enough to learn from.
The principle that should guide every channel decision in 2026: master one or two high-intent channels before adding another.
Channel Prioritisation Matrix
Score each potential channel on three criteria:
- Buyer intent: Where are your buyers actively searching for solutions?
- Reach: Can you access enough ICP-fit accounts to hit pipeline targets?
- Cost efficiency: What’s the expected CAC relative to your ACV?
Let me walk through the top channels and when each makes sense.
| Channel | Intent Level | When To Use It |
|---|---|---|
| Paid Search (Google, Bing) |
Very High Bottom-of-funnel |
You have clear product category keywords with commercial intent (“revenue operations platform,” “sales enablement software”). Strong for capturing existing demand from buyers already in-market and evaluating solutions. ⚠ Where it breaks: Your product is too new or niche for meaningful search volume. If you’re creating a category rather than competing in one, paid search will not generate the returns you need. |
| LinkedIn Ads | Medium Interruption-based |
Well-defined ICP with specific job titles, company sizes, and industries. You can support $15–50 CPCs to reach decision-makers and your ACV justifies it. Precision targeting outperforms volume plays here. ⚠ Where it breaks: Your ACV is below $15K, LinkedIn CAC will destroy your unit economics. Without tight ICP filters, you risk high spend with limited pipeline to show for it. |
| Content + SEO | Varies Top to bottom funnel |
You can commit to a 6–12 month payback window and produce genuinely useful content. Top-funnel content attracts researchers; bottom-funnel content captures high-intent buyers. A long-term compounding asset when done with consistency. ⚠ Where it breaks: You need pipeline this quarter. Generic content in a crowded search landscape will not move the needle, and if competitors already own the category, you need a clear differentiation strategy before investing here. |
| Outbound (Email, LinkedIn) |
Low Initially Created via triggers |
Tight ICP with signal-based targeting (funding events, hiring trends, tech stack changes) and personalised messaging relevant enough to cut through the noise. ⚠ Where it breaks: You’re sending generic messaging to broad lists without trigger-based timing or meaningful personalisation. Volume without relevance accelerates rep attrition and damages your sender reputation. |
| ABM (Account-Based Marketing) |
Created Through orchestration |
ACV above $50K with multi-stakeholder buying committees. Target 100–300 named accounts with personalised, multi-channel campaigns across LinkedIn, direct mail, and retargeting. Measure account engagement, not lead volume. ⚠ Where it breaks: You’re attempting ABM at scale across thousands of accounts; it requires focus, not volume. If your ACV doesn’t support the cost of multi-touch personalisation, the economics will not work in your favour. |
| Community + Dark Social (Slack, Discord, Reddit) |
High When done right |
Developer tools, horizontal SaaS, and products that benefit from peer recommendations. Works when buyers congregate in identifiable communities and trust peer advice over paid media. ⚠ Where it breaks: You’re trying to force attribution on dark social activity or showing up purely to pitch. If your buyers are dispersed across private channels, a community-led motion will be difficult to scale with any consistency. |
Measurement & Optimisation: Embracing Revenue Metrics
If your GTM review still opens with MQLs and click-through rates, you’re measuring the wrong things. Investors in 2026 are scrutinising revenue efficiency: CAC payback period, Net New ARR, NRR, and LTV:CAC.
Obsess over those, and the vanity metrics take care of themselves.
| Metric | Formula & Benchmark | Best Practices |
|---|---|---|
| CAC Payback Period | Formula: (Sales & Marketing Spend) / (Net New MRR × Gross Margin %) Benchmark: Median 8.6 months, top performers 5–7 months |
Track monthly by channel, not in aggregate. If paid search pays back in 6 months but LinkedIn takes 14, the blended number masks the problem. Under 6 months means there’s room to scale spend while maintaining efficiency. Above 12 months means you need to address CAC or increase ACV before investing further. |
| Net Revenue Retention (NRR) | Formula: (Starting ARR + Expansion - Downgrades - Churn) / Starting ARR Benchmark: Elite SaaS hits 90%+ GRR and 120%+ NRR |
Build expansion into the product from day one. Usage-based pricing creates natural expansion; team features drive seat growth. Use product signals proactively, when a customer hits 80% of plan limits or adds five or more colleagues, that’s your CS team’s cue to reach out. At 120%+ NRR, your existing base alone grows the business 20% annually. |
| LTV:CAC Ratio | Formula: (Average Customer LTV) / (CAC) Benchmark: Healthy SaaS maintains 3:1 to 5:1 ratio |
Always calculate by segment and cohort vintage, never in aggregate. Your blended ratio can look healthy while enterprise drags and SMB performs; segment-level analysis is the only way to avoid false confidence. Below 3:1 means acquisition spend is outpacing returns. Above 5:1 suggests you’re underinvesting in growth. |
| Pipeline Velocity | Formula: (# of Opps × Avg Deal Size × Win Rate) / Sales Cycle Length Benchmark: Companies tracking weekly grow 34% faster |
Track weekly, not monthly: a 10% drop in win rate or a five-day increase in cycle length compounds quickly. Monitor by rep, segment, and source. You have four levers: increase deal size, improve win rates through tighter qualification, reduce sales cycle friction, or generate more top-of-funnel volume. Identify which constraint is limiting velocity and address that first. |
| Net New ARR | Formula: New Customer ARR + Expansion ARR - Churned ARR Benchmark: Month-over-month growth indicates a healthy GTM engine |
Break it down monthly by new logo ARR, expansion ARR, and churned ARR; never look at the total in isolation. If new logos are growing but expansion is flat, your product isn’t driving the depth of adoption it needs to. If expansion is strong but new ARR is declining, your acquisition motion needs attention. The components tell the real story. |
Building Your Revenue Dashboard
Pull all this data into a single revenue dashboard. I recommend this structure:
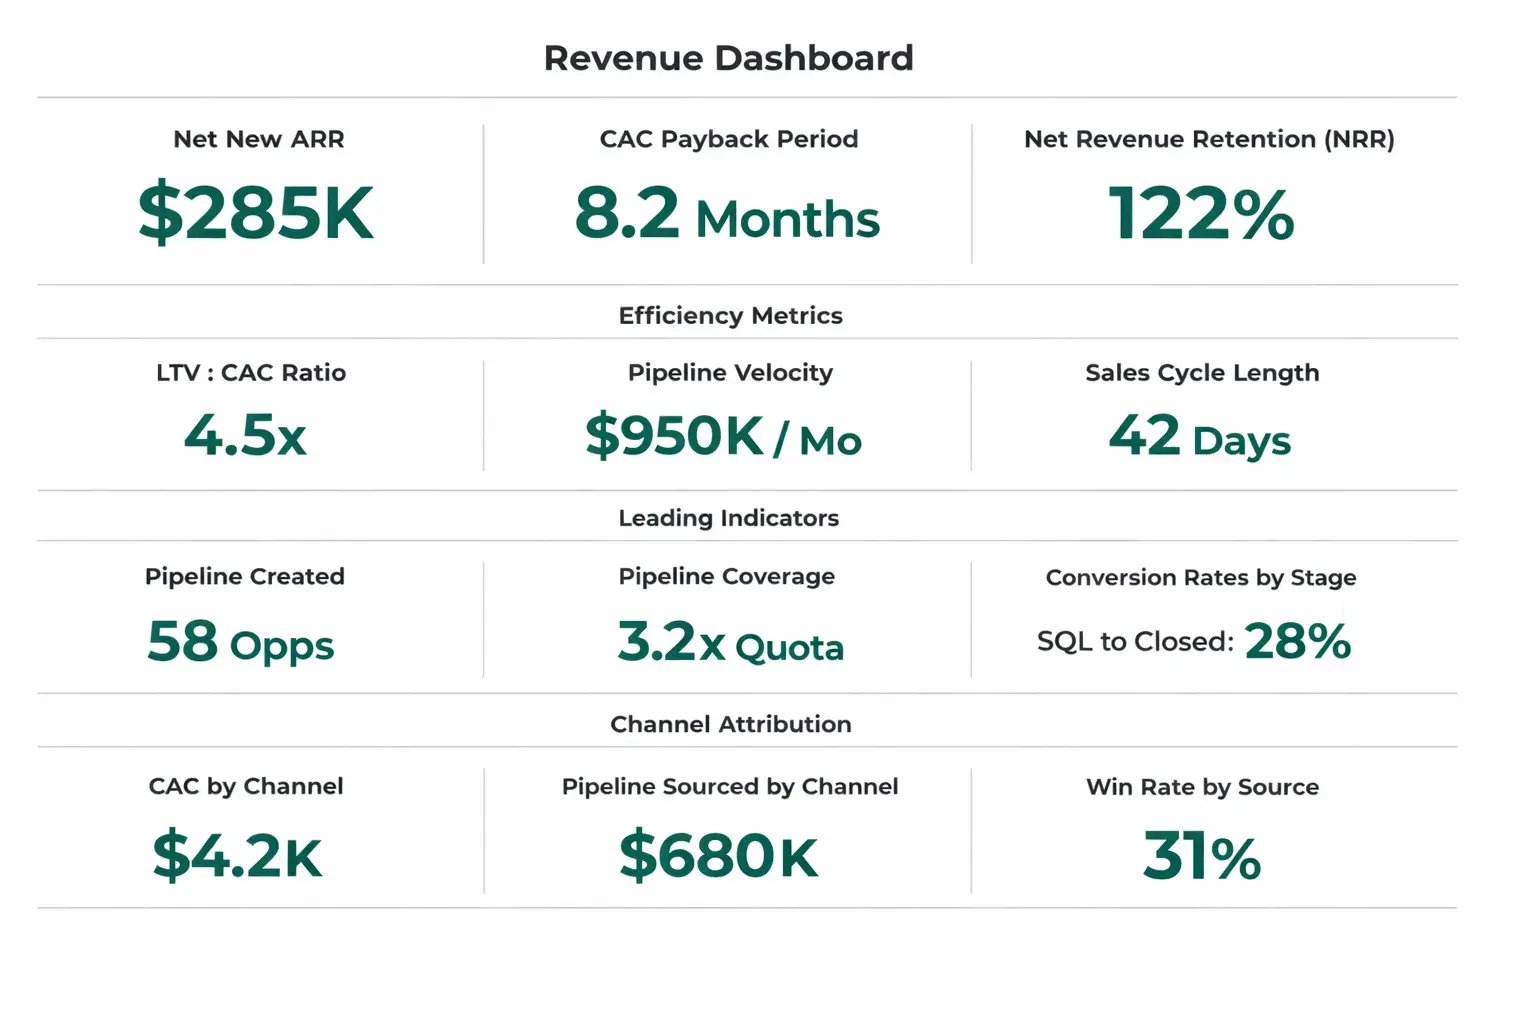
Top row is your headline numbers. Below that, efficiency metrics show whether growth is sustainable. Leading indicators give you early warning before anything hits the headline numbers. And attribution tells you exactly which channels are earning their place.
Review this weekly with your revenue team. Not just marketing. Not just sales. Everyone who touches the customer journey should be looking at the same dashboard and moving in the same direction.
Establishing Feedback Loops
Metrics without a structured review process are just numbers on a screen. Every quarter, sit down with your revenue team and work through the same four areas:
| Review Area | What To Look At |
|---|---|
| Cohort Performance | Which customer segments have the highest LTV and lowest churn? Look for patterns across industry, company size, and growth stage. The segments that retain and expand are the ones worth doubling down on. |
| Win/Loss Analysis | Why did deals close, and why did they fall apart? Look for patterns in lost deals by segment, competitor, deal size, and sales stage. The losses often tell you more than the wins. |
| Channel ROI | Which sources are delivering the best CAC and fastest payback? Strip out the channels that look active but aren’t closing revenue. Concentrate resource where the unit economics actually work. |
| ICP Refinement | Update your ICP based on which segments are actually converting and expanding. Your ICP at month three should look different to your ICP at month twelve. If it doesn’t, you’re not learning fast enough. |
How an AI SaaS Fixed Its GTM Motion and Drove 178% More Pipeline
AI Project Management Platform (Series A)
Context:
-
ICP too broad; messaging targeted anyone running projects
-
Inbound traffic was healthy but converting at 1.8%
-
Trial-to-paid conversion: 12% (vs. 18-22% industry benchmark)
-
Demo-to-close at 23% with an 87-day average sales cycle
What we found:
The GTM motion around the product had no defined buyer at its centre: messaging, content, and channel strategy were all pulling in different directions. A VP of Engineering or CTO at a Series A or B SaaS company had no clear reason to stay on the site, let alone convert.
What changed:
- Phase 1: Full funnel audit. We mapped every drop-off point across messaging, content, and trial activation to identify where qualified buyers were disengaging.
- Phase 2: ICP-led repositioning. Messaging was rebuilt around the specific outcomes that mattered to the economic buyer, not product capabilities, but business impact.
- Phase 3: Buyer enablement at scale. Comparison pages, ROI guides, and implementation content gave ICP-fit prospects everything they needed to make an internal business case before ever speaking to sales.
Impact (within one quarter):
-
Demo signups up 178%
-
Trial-to-paid conversion up 62%
-
CAC down 38%
-
Sales cycles shortened by ~3 weeks

Building a GTM Stack That Earns Its Place in Your Budget
Underinvesting in infrastructure is one of the most consistent GTM execution failures I see. Here’s what earns a place in your budget at each stage of growth:
| Category | Top Tools | Best For |
|---|---|---|
| Foundation / CRM | HubSpot, Salesforce, ChartMogul | Pipeline visibility and revenue tracking. HubSpot fits PLG and SMB motions; Salesforce for complex enterprise deals with multi-stage forecasting. |
| PLG Enablement | Mixpanel, Amplitude, Appcues, Stripe | Turning product usage into pipeline. Ideal when free trial or freemium is your primary acquisition motion and PQL scoring drives sales handoffs. |
| Sales Engagement | Outreach, Salesloft, Apollo | Outbound scale and cadence management. Best when SDR teams need structured sequencing, A/B tested messaging, and activity tracking at volume. |
| ABM | 6sense, Demandbase, ZoomInfo | Intent-driven TOFU for enterprise deals. Right fit when ACV exceeds $50K and you're targeting a defined list of 100–300 named accounts. |
| Content & Channel | Marketo, Ahrefs, Google Ads, LinkedIn | Demand gen and pipeline influence. Strong fit when nurturing long buying cycles through SEO content, paid retargeting, and multi-touch email sequences. |
| RevOps & Attribution | Gong, HockeyStack, Dreamdata, Looker | Forecast accuracy and GTM alignment. Ideal once you’re scaling past $5M ARR and need to connect marketing spend, sales activity, and revenue outcomes in one view. |
GTM Mistakes Stalling Growth in 2026
Even with the right framework, execution fails when teams make these mistakes:
| Common Mistake | Best Practices |
|---|---|
| Targeting too broad | Your ICP should exclude more companies than it includes. Narrow to 3–5 firmographic filters: size, industry, tech stack, deal stage, until your TAM is under 10,000 companies. Win deeply in a tight segment first, then expand. |
| Mixing motions incorrectly | PLG works under $25K ACV with fast time-to-value. Sales-led works above $50K ACV with multi-stakeholder buying. If you serve both SMB and enterprise, build separate motions: self-serve for SMB, sales-assist for mid-market, full enterprise sales for $100K+ deals. Don’t force one motion to serve all segments. |
| Channel sprawl | Pick one BOFU channel and one TOFU channel. Run both for six months until CAC payback is under 12 months. Build real expertise before adding a third. Spreading too thin too early means nothing works well enough to learn from. |
| Measuring motion, not revenue | Every weekly GTM review should start with: “What’s our Net New ARR this month?” Then work backwards: pipeline coverage, conversion rates, CAC by channel. Use motion metrics (MQLs, traffic) to diagnose problems, not celebrate wins. |
| Treating GTM as static | Run a quarterly GTM review, 30 to 60 minutes with your exec team. Pressure-test your ICP against win rates, check if your motion still fits your deal sizes, and audit channel efficiency before CAC quietly creeps up on you. |
Put Your GTM Strategy to Work: ICP, Motion, and Channel Tools
Use these three tools to pressure-test your ICP, motion, and channel strategy before committing resource to any of them.
Firmographic Criteria
Technographic Signals
Behavioral Indicators
Pain Points & Buying Triggers
Decision-Makers & Champions
Additional Notes
Audit and Refocus Your GTM
If you’ve made it this far, you know that a “good enough” GTM strategy is just a faster way to burn cash. Don’t leave this page without putting these frameworks into practice. Use the ICP Builder and Motion Mapper above to turn this theory into a documented plan for your team.
If you’d rather not go it alone, schedule a consultation with our advisory team. We’ll audit your GTM approach end-to-end and define the practical changes required to improve pipeline quality and payback.